
Extreme weather causes the majority of power outages with economic impacts that range from $50B to $100B a year over the United States. The power grid is particularly vulnerable as approximately 80% of the electric distribution system is overhead or above ground. Power outages may occur when extreme weather hazards (e.g., high wind) stress infrastructure beyond rated design, or failures from conflicts related to vegetation (trees) within right of ways. Danger trees, those outside of the right of ways, that are large enough to fall into lines are particularly high consequence. We continue to lag on upgrading our power grid to be resilient with aging infrastructure and climate-extreme weather change in the face of our reliance on electrification for decarbonization. Having a robust asset-based risk framework that incorporates extreme weather stressors will improve resilience for more informed storm-based preparedness and long-term planning use cases.
High winds cause the greatest number of power outages from physical damage. High winds can be simplified into two geospatial classes, those are wide-area and more localized events. Wide-area events are large storm systems that often produce widespread damage such as from hurricanes or mid-latitude cyclones (e.g., nor’easters). Localized events are often associated with thunderstorms. Most thunderstorms produce relatively small but potentially high-impact damage (e.g., tornadoes), but under rare conditions thunderstorm cells can grow upscale to produce more wide-area long-lived wind damage from derechos.
For an electric distribution utility over the Northeast US, we see that around 61% of outages were associated with wide-area wind events, whereas winds from thunderstorms contributed 9%, and wet snow and ice were associated with the remaining 30% (Figure 1). Approximately 10% of storm events were multi-hazard with some association of winds and wet snow/ice loading either during or after wet snow/ice loading. Heavy rainfall and flooding were not a significant factor, although heavy rainfall produces wet soil moisture conditions that increases risks from tree uprooting under high winds. Heavy precipitation often has the effect of reducing wind gust potential by increasing atmospheric stability. The fall and early winter storm season contributed the majority of outage impacts. One of the strong climate change signals at this location is an expansion of the fall storm season into the winter with a warmer and wetter winter (e.g., warmer storm profiles produce more wet snowfall).
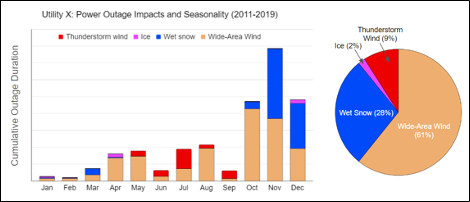
Figure 1. Power outage impacts and root cause for a utility over the Northeast US.
Each storm event is unique, often making a combination of technology solutions and human-in-the-loop knowledge an optimal solution for making preparedness decisions. The recent southeasterly wind event on January 10, 2024 across Vermont shows how down-sloping winds from the Green Mountains produced higher winds and were cross-correlated with areas of outages (Figure 2). High resolution modeling of such winds is available from NOAA’s HRRR model was able to capture the magnitude and location of these winds approximately 36 hours prior to event onset, whereas NOAA’s National Blend of models detected this storm signal effectively four days prior.
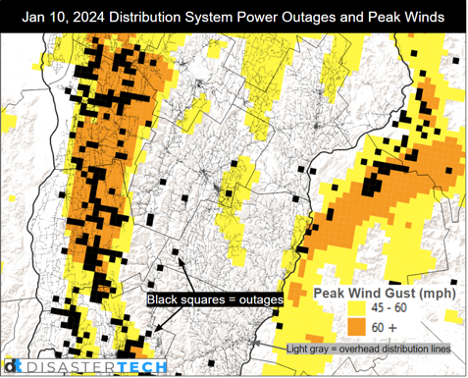
Figure 2. Power outages and observed peak winds from Jan 10, 2024 southeasterly wind event. Black squares are at a 2.5 km raster grid.
In order to make extreme weather hazard-forced risks relevant to grid operations, a robust GIS framework can be used to derive an asset-based approach. Asset-based risk provides risk where it matters onto the grid and can be asset-weighted in order to account for the potential fragilities or vulnerabilities where they matter. If there are high winds where there is limited or no infrastructure, then those values shouldn’t be weighted as much where there are high winds and more infrastructure. A simple way of doing this includes a summation of overhead line distance within a region and weighting the wind risk by infrastructure. Figure 3 shows two towns and how such an approach could be implemented. If the town polygon itself is used to determine the average wind value, then town B has a much higher effective wind speed value. However, town B does not have much infrastructure with the highest wind speeds. After weighting each town, the effective wind speed stress is nearly equivalent between the two towns. Additional information such as overhead exposure along individual feeders and geotranslated for grid topology can be derived from such an asset-based framework.
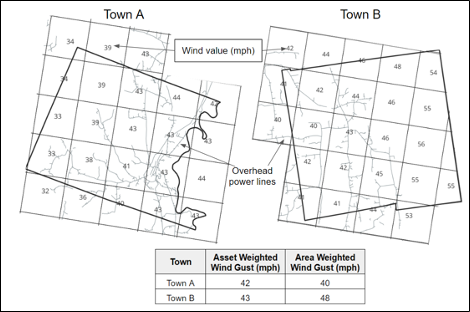
Figure 3. Demonstration of how to relate topographical risk to the grid using an asset-based risk framework. Effective wind information unit is a 2.5 km raster.
An asset-based risk framework can be used to illustrate robust analytics that show potential system-wide impacts at differing scenarios to inform storm preparedness levels. This information can be used for no-regrets preparedness decisions based on authoritative information that is engineered to the grid. The below prediction example in Figure 4 shows how these results can be visualized to show where and how bad storm impacts may be. In this case, a strong storm signal is detected four days prior and that forecast was refined by 24-36 hours prior based on the HRRR model prediction.
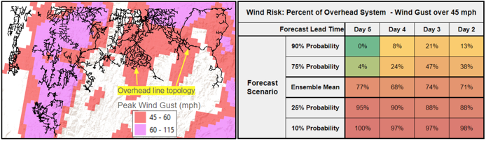
Figure 4. VEC and predicted winds from HRRR across their system risk distribution (left) at 24 hours prior. Table showing risk profile of winds from National Blend of Models (right).
Connecting extreme weather hazards across electric transmission and distribution infrastructure enables new insights for a variety of use cases. A robust asset-based GIS framework can be used to inform emergency preparedness levels for no-regrets preparedness decisions based on critical values. This information can potentially be shared to build trust with customers around events, after-action reporting for regulatory compliance, and to develop new cross-company knowledge on system vulnerabilities for climate resilience planning. By combining this framework with other asset and tree cover information and using AI-based (machine learning), advanced outage prediction systems can be developed for asset maintenance, storm-based preparedness, and long-term planning. Predictive inputs from these frameworks can be used as inputs to optimize the grid operation around storm events in a storm mode where energy management systems can dynamically adapt for energy resilience, such as optimizing storage when there may be known long-duration outages. Now is the time to embrace such technology integration, as there is rich open-source extreme weather impact data and information waiting to be applied to grid reliability.
To learn more about how Disaster Tech supports crisis managers during extreme weather, visit www.disastertech.com/pratus.
About Disaster Tech
Disaster Tech, a veteran-owned public benefit company, offers decision science technologies for situational awareness, intelligence, and crisis management. We provide practitioner-driven, crisis management software for smarter decision making in preparedness and response to ultimately save lives and protect the environment. To learn more, visit www.disastertech.com.
Disaster Tech Media Contact:
Jaclyn Silvestri
Jaclyn@disastertech.com

